Process Control

Keep production stable as conditions change

Close the loop on process control. Ethon monitors every critical parameter in real time, automatically adjusts setpoints when processes drift, and keeps lines running at peak performance.

Oil painting of a factory hall with orange robotic arms working on a production line Ethon AI process control dashboard showing monitoring target chart with simulation and parameter ranges

Keep processes stable and centered. Identify drivers of drifts and adjust controllable parameters accordingly.

The first process control workflow that combines advanced Causal AI technology with automated setpoint steering.

More than
0X
More effective control lever detection

Benchmarks show Ethon’s causal models consistently find the setpoints that most effectively reduce drift and stabilize the process.

Up to
0X
Reduced deviations from the centerline

Customers have achieved significantly tighter process control through live causal steering that continuously corrects deviations.

USD
0k+
Annual savings per line

Proven across active deployments through reduced variability, fewer manual adjustments, and more consistent in-spec production.

01 Detect

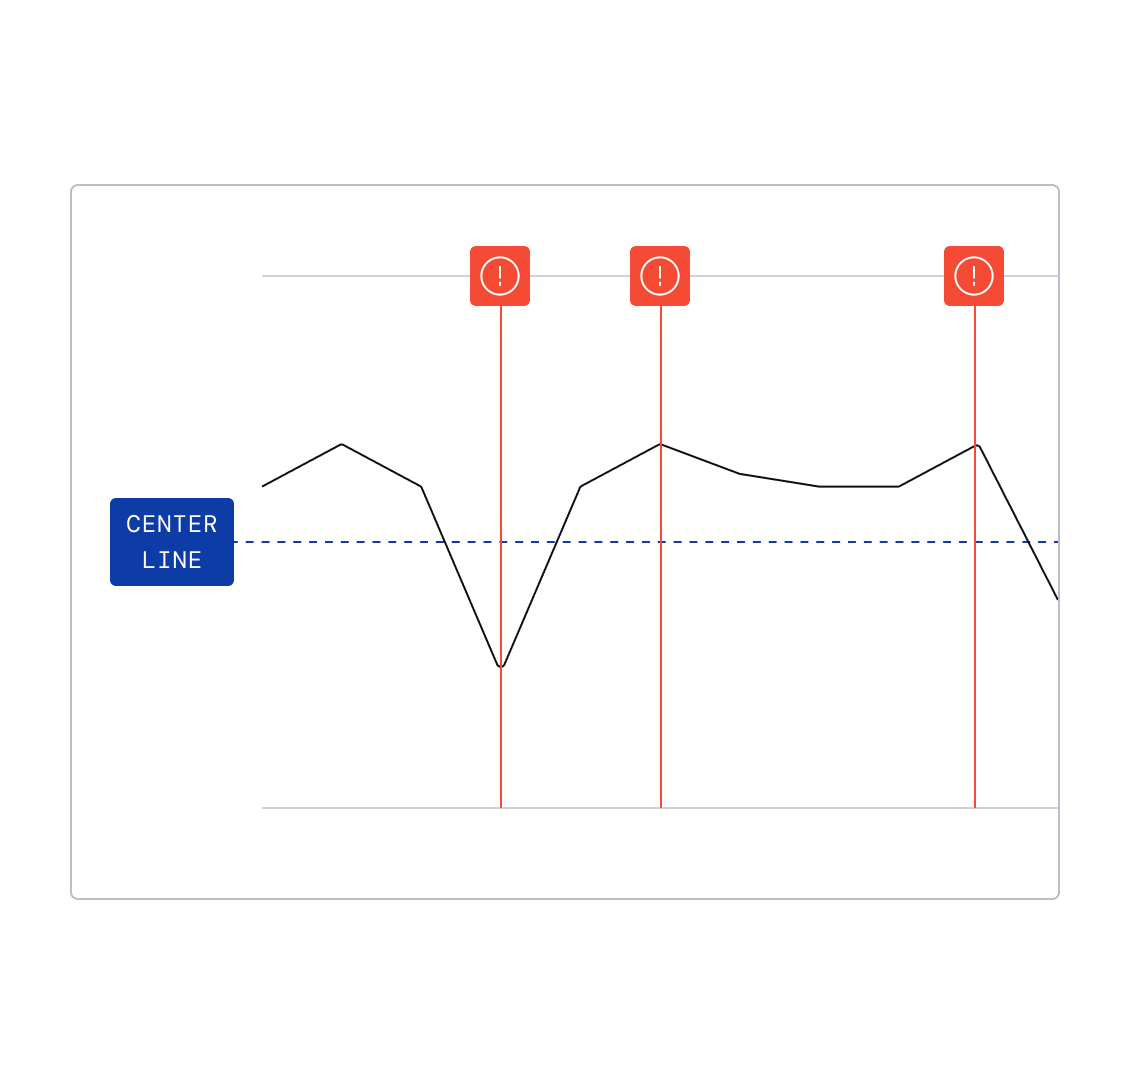
Detect process drift in real-time

Ethon continuously monitors critical process parameters against defined targets. When a value starts to move off-center, agents detect the deviation immediately and trigger an automated diagnostic workflow.

Time series chart with limit threshold line and red warning markers indicating detected process drift
02 Aggregate

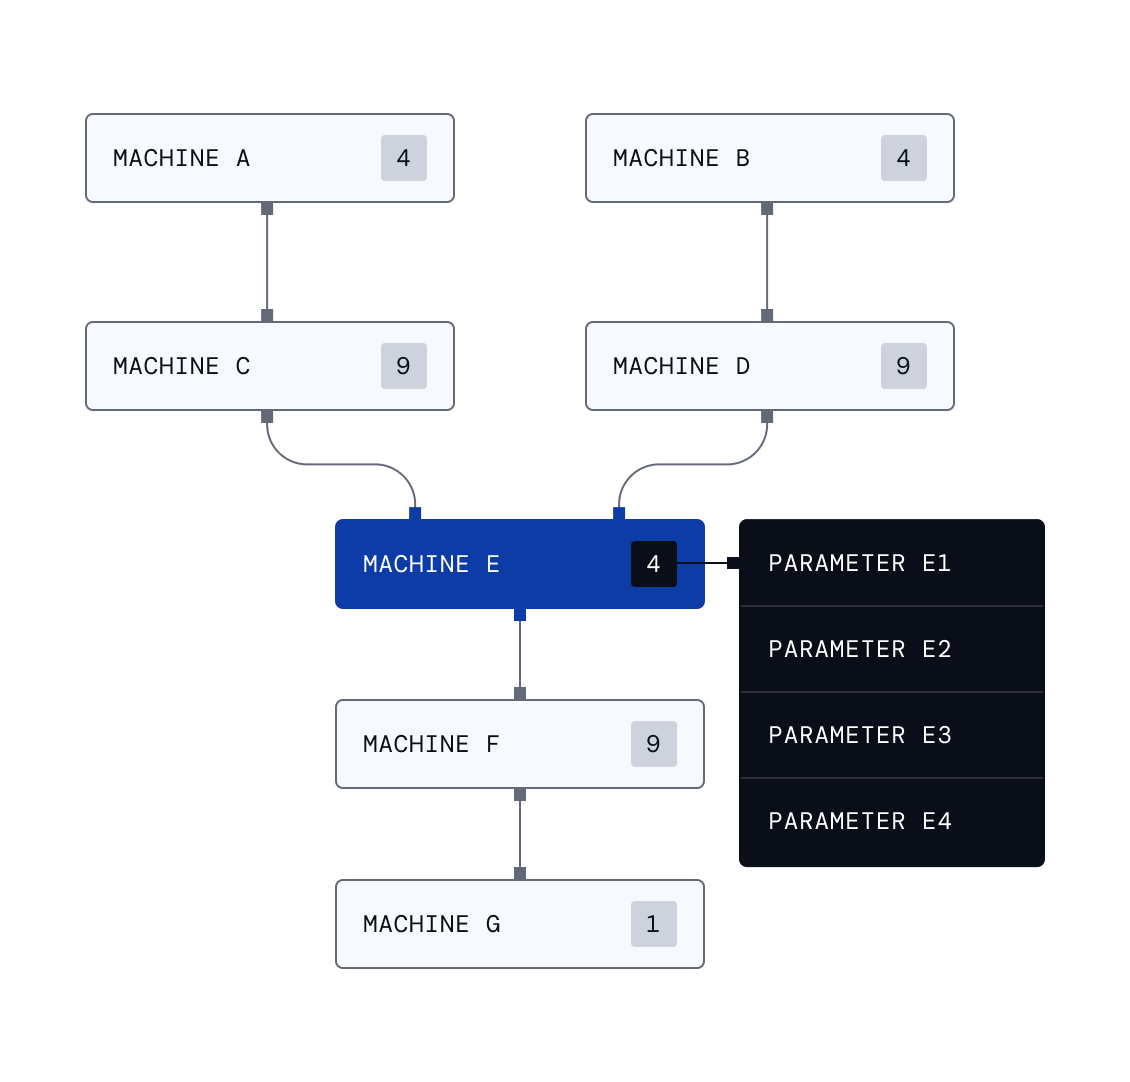
Auto-aggregate all relevant data

Ethon compiles all parameters that influence the drifting outcome, including every controllable setpoint on the line. Data is aligned across equipment and process steps, ensuring the optimization is grounded in a complete, structured representation of production.

Production line flowchart with machines A through G showing parameter counts and data aggregation
03 Configure

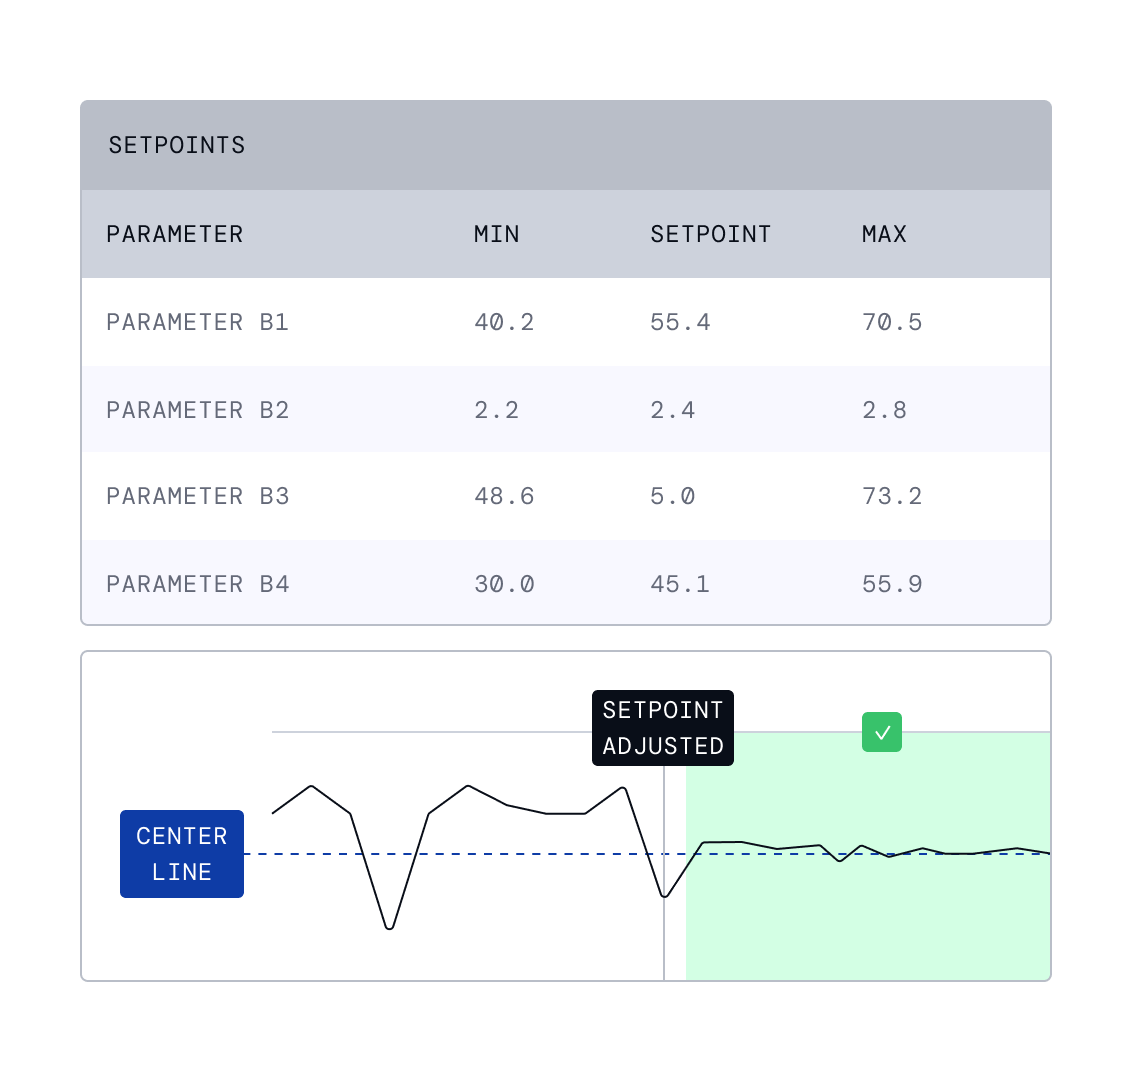
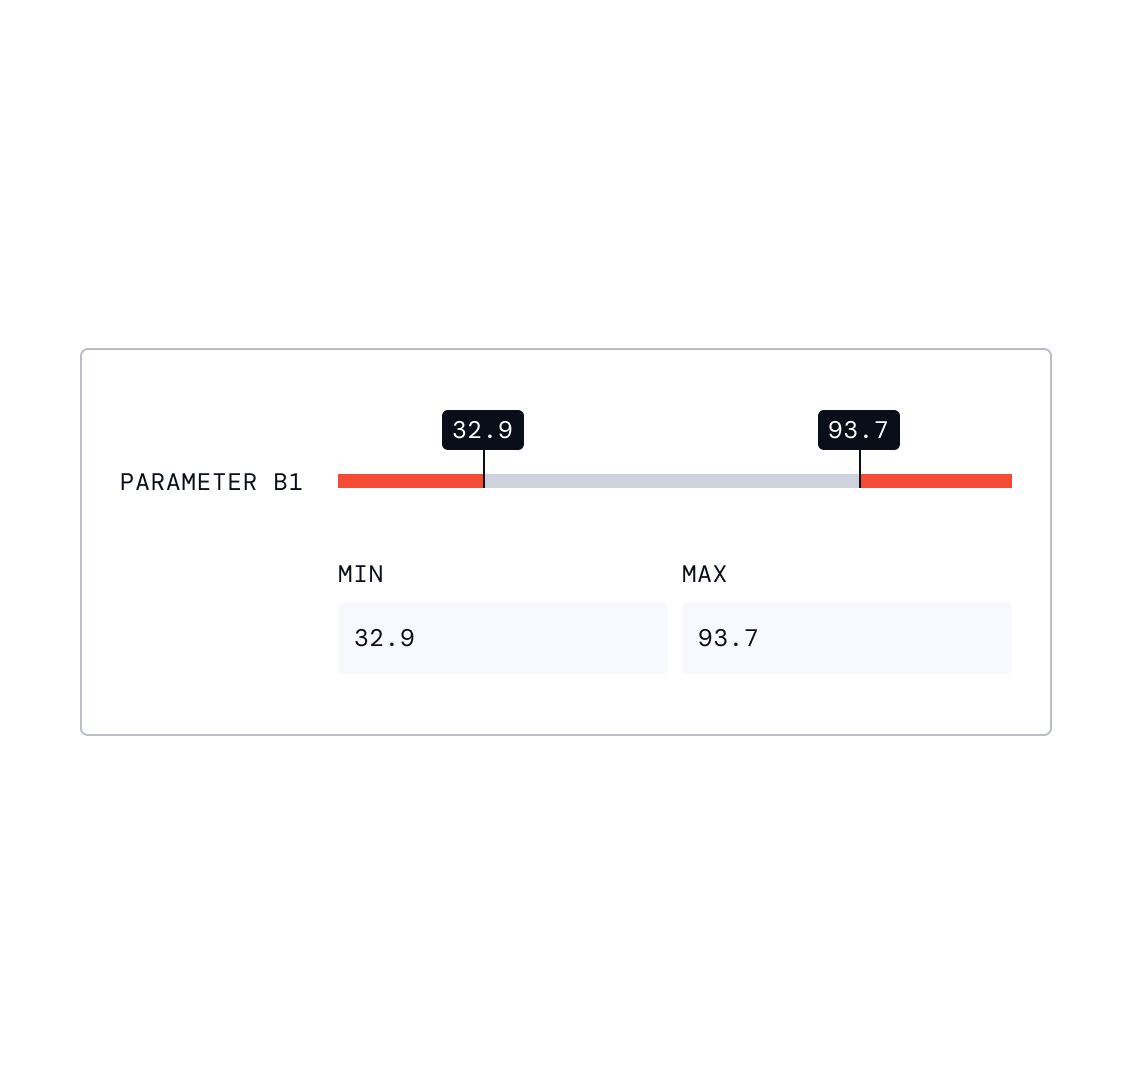
Define safe operating ranges

Engineers define minimum and maximum allowable values for each adjustable setpoint. These ranges ensure that automated steering operates safely, respects equipment constraints, and adheres to process rules.

Parameter B1 range slider showing safe operating zone between min 32.9 and max 93.7 with red out-of-range areas
04 Model

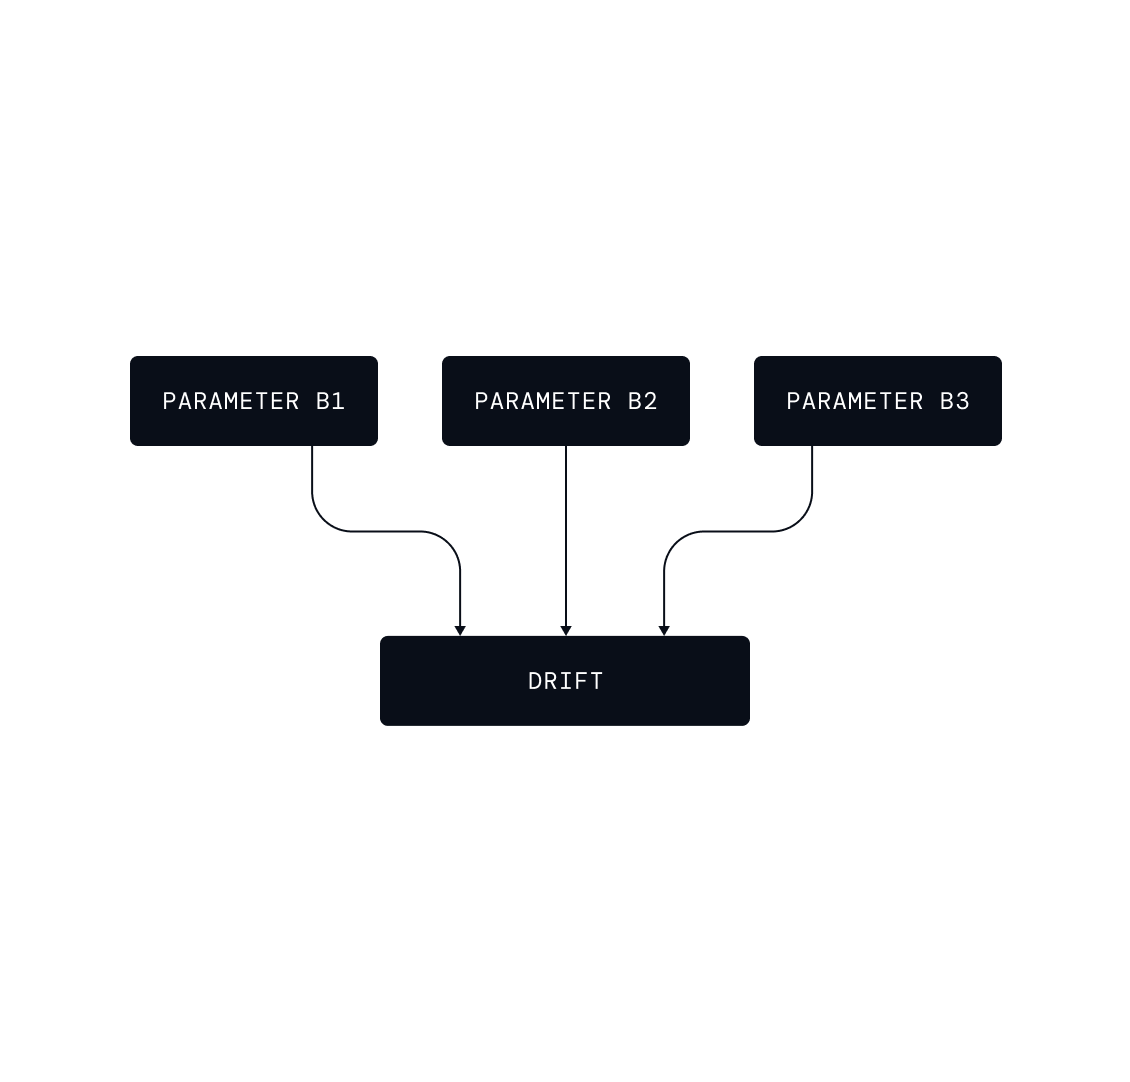
Model how drift propagates

Using the process knowledge graph, Ethon’s causal model understands how process parameters, machine setpoints, and environmental conditions drive the detected drift. The causal model mirrors real process behavior, revealing how changes propagate through the line.

Hierarchical machine topology with highlighted upstream control group feeding into downstream processes
05 Recommend

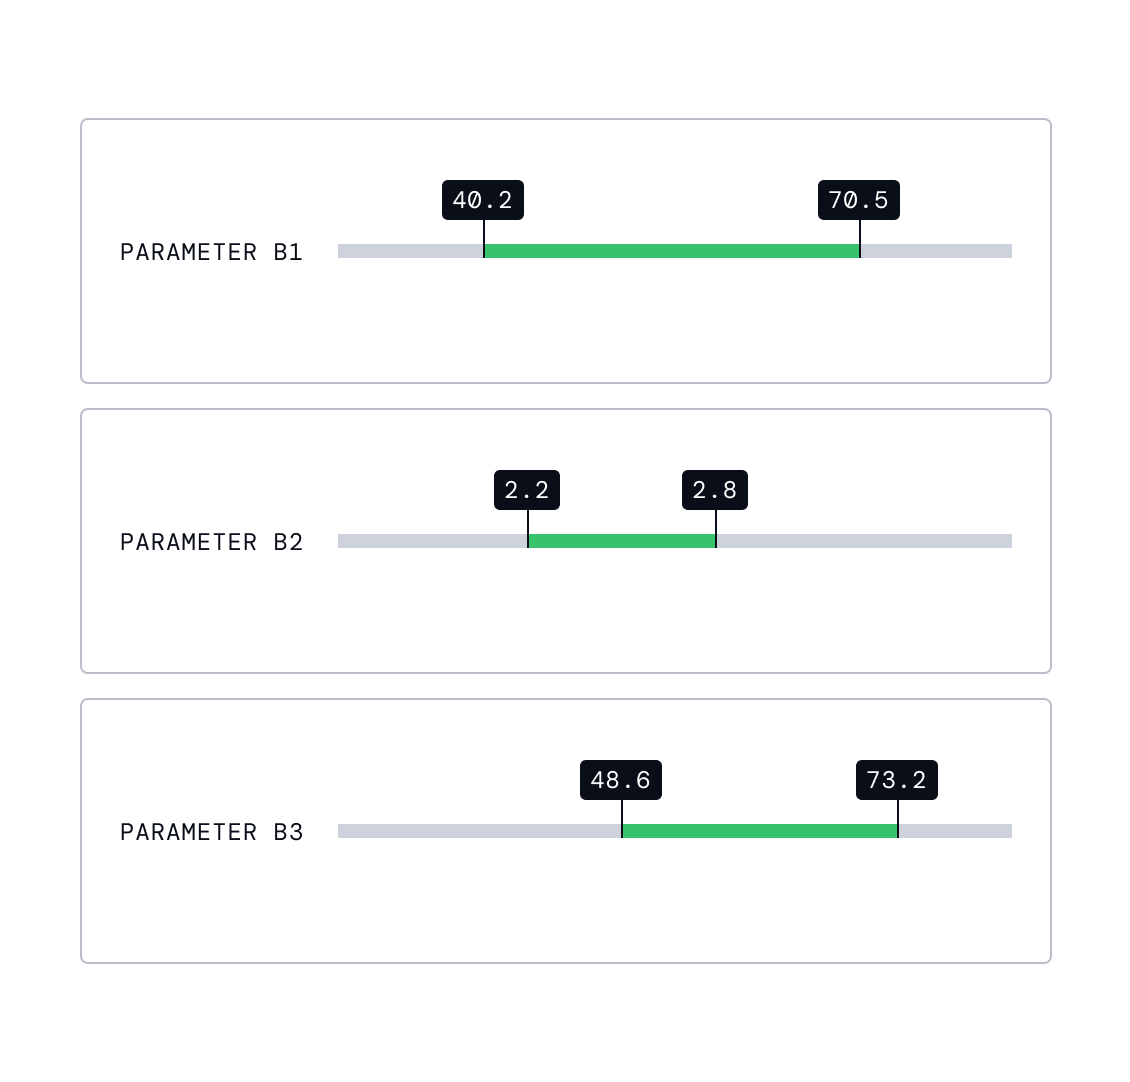
Compute corrective setpoints

Based on the causal graph and historical behavior, Ethon computes the optimal setpoints to counteract the drift. Recommendations include direction of change, magnitude, and expected impact on process stability.

Recommended setpoint ranges for parameters B1, B2, and B3 shown as green bands on slider controls
06 Control

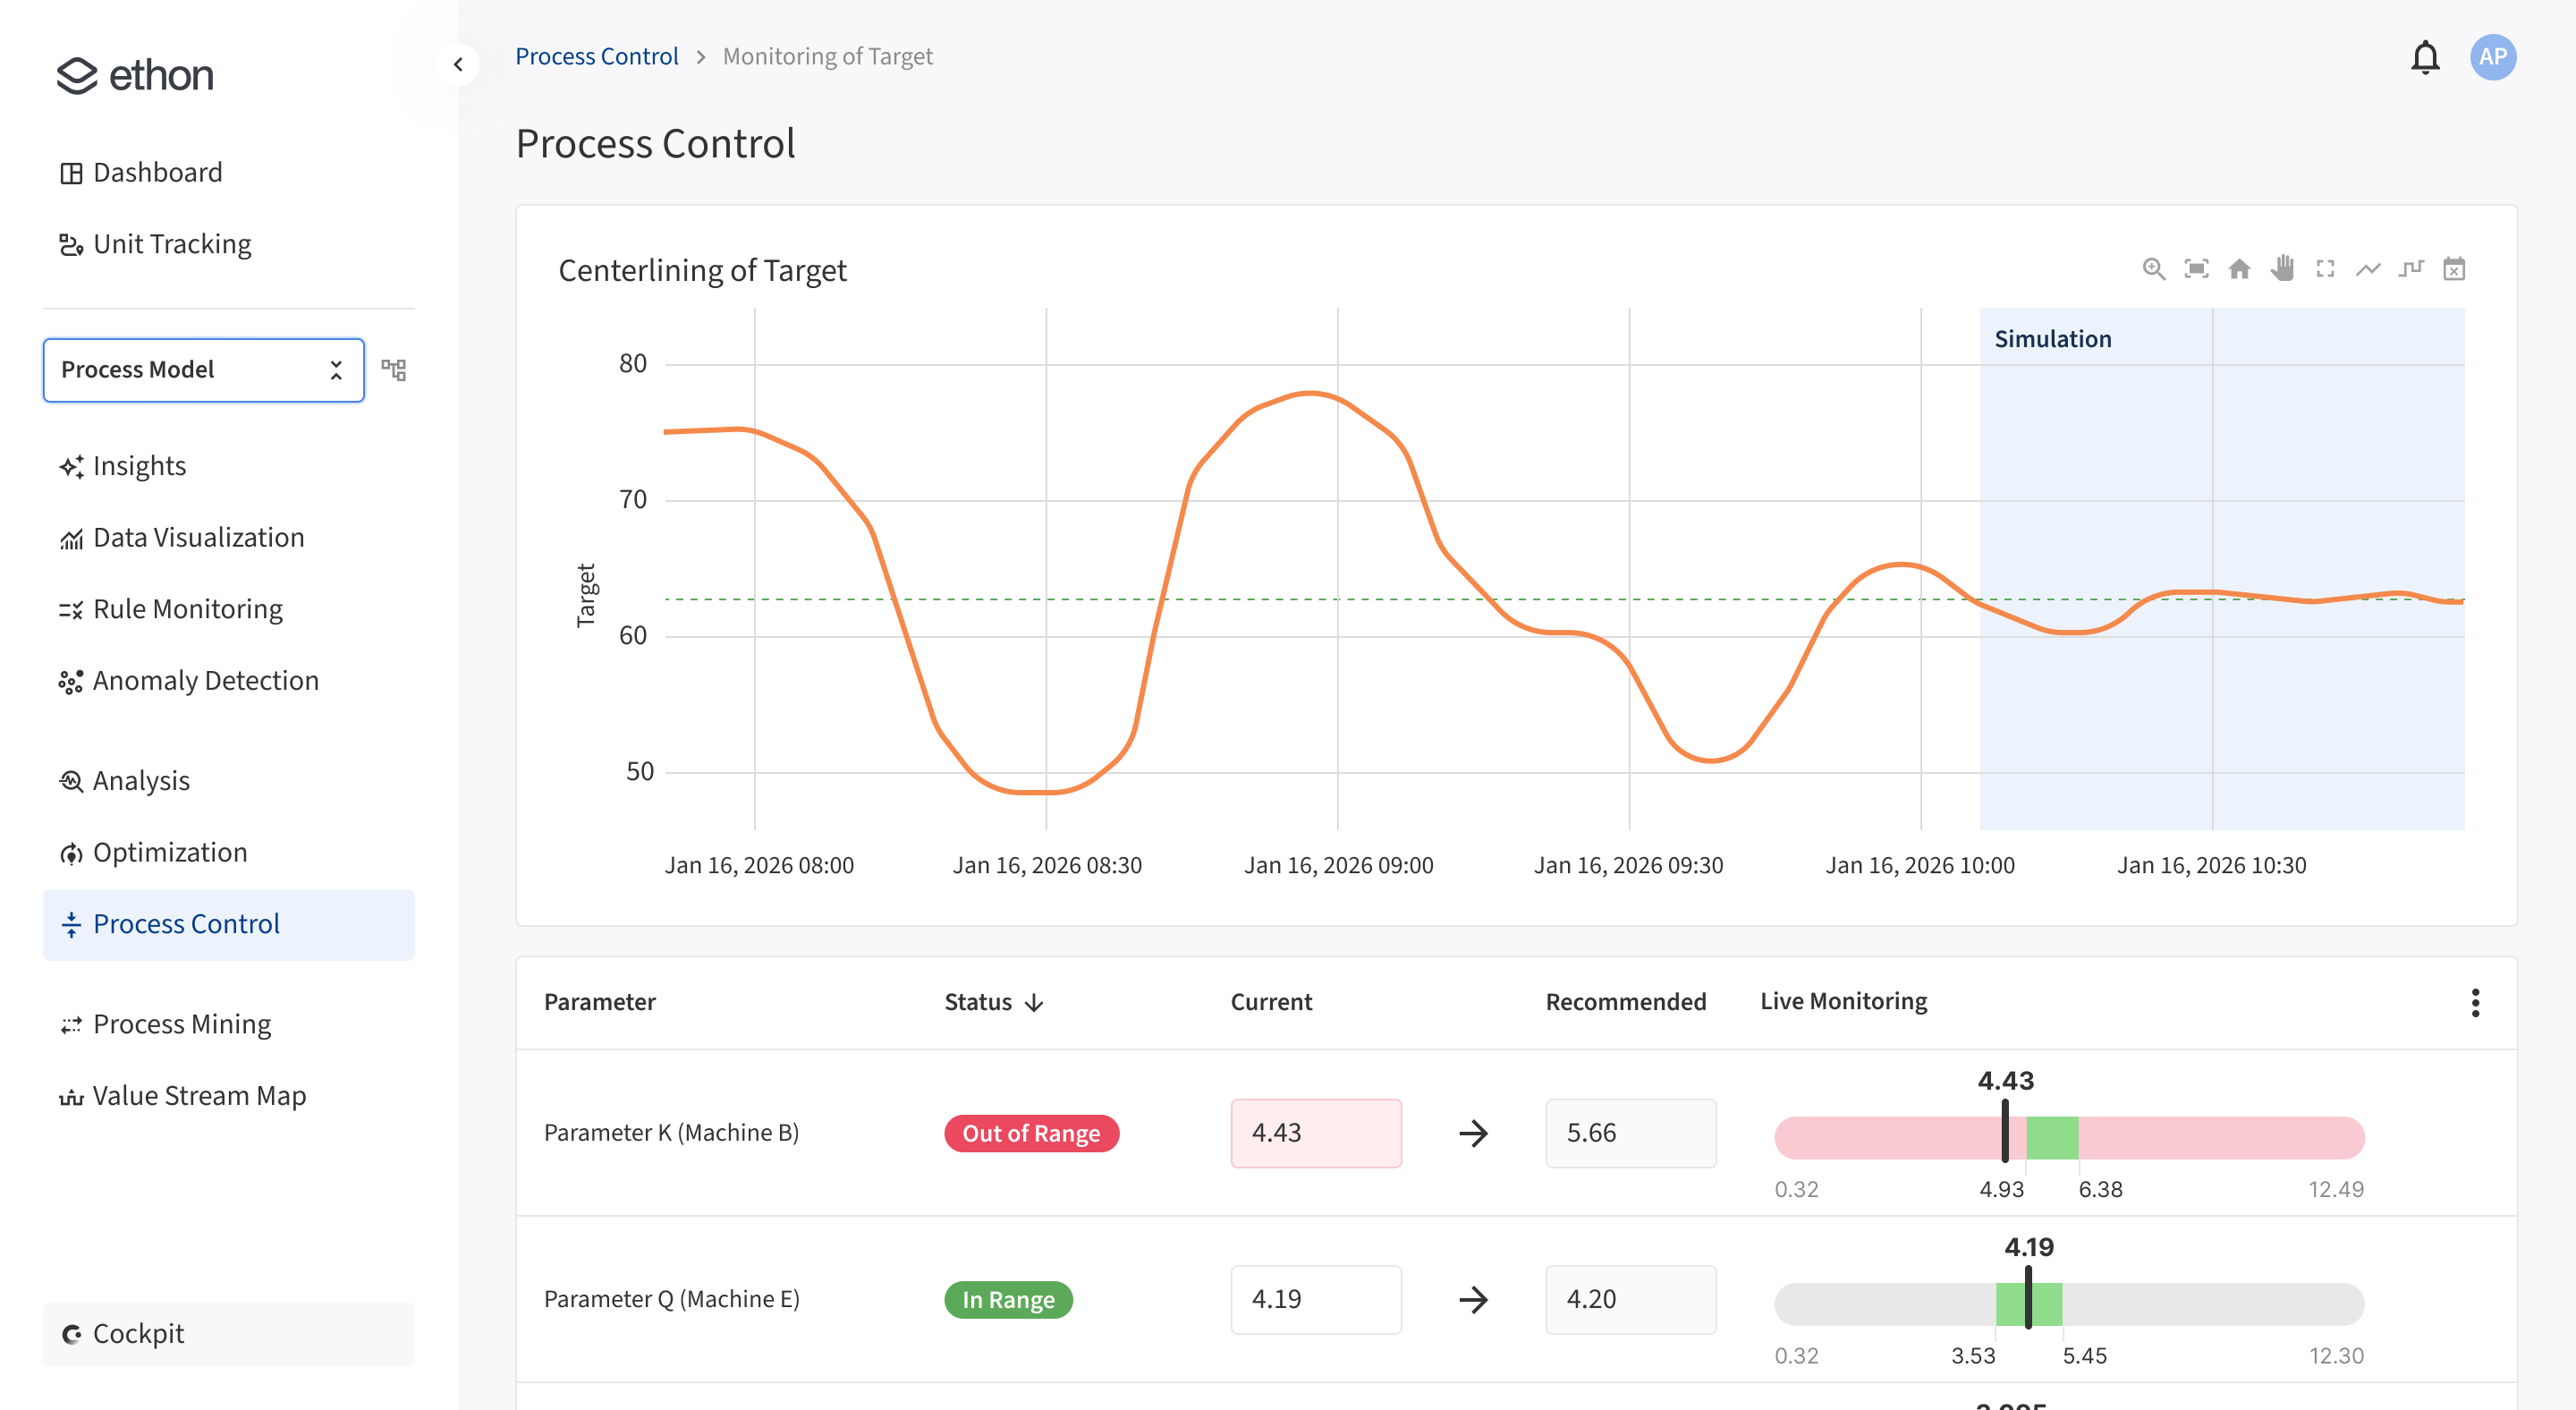
Steer processes continuously

Ethon continuously monitors conditions and updates recommended setpoints as the process evolves. Operators can apply adjustments directly via SCADA HMI, or recommendations can be pushed to PLCs for automated control—keeping the process centered with minimal manual intervention.

Setpoint adjustment table with min, setpoint, and max values alongside a trend chart showing improved stability after steering

Frequently asked questions

What are typical use cases for process control?
Process control usually comes after root cause analysis and process optimization. It’s about keeping lines stable that are already well-understood and instrumented. For example, adjusting control settings to counteract variability in raw material inputs.
What data does Ethon need to perform process control?
Ethon connects to existing factory data sources such as MES, PLCs, Historians, sensors, and IoT platforms. The more complete the process data, the more precise the causal setpoint recommendations, but even limited datasets can provide meaningful ones. The closer data is streamed in real time, the faster the loop can be closed.
How much data is needed to get meaningful recommendations?
Process control follows root cause analysis and process optimization. EthonAI typically works with anything from 30–40 batches or parts to millions of production runs, and from around 10 to several thousand measured parameters.
Does Ethon require data scientists to use?
No. The workflow is designed for process experts and operators. Analyses are triggered automatically, and results are presented as clear, explainable reports. That said, many data scientists use Ethon through our Jupyter notebook integration to pull results directly, compare them with custom analyses, and extend workflows using Python.
How long does implementation take?
Most deployments take about two weeks to connect data sources and start running analyses. Customers typically generate value within three months.

Stop chasing problems.
Stay in control.

Meet our engineers to explore how Ethon supports your operational excellence programs.