Process Optimization

Identify and eliminate hidden waste

Deliver step-change productivity across your lines. Ethon continuously scans all process data, spots hidden inefficiencies, and recommends the optimal parameter setpoints to optimize quality and throughput.

Oil painting of a modern factory floor with robotic arms and industrial machinery in soft pastel tones Ethon AI monthly analysis dashboard showing key parameter insights and recommended ranges

Identify hidden inefficiencies and compute optimal setpoints based on cause–effect relationships.

The first process optimization that continuously improves production outcomes with Causal AI technology.

More than
0X
More precise in identifiying optimization levers

Benchmarks show Ethon’s causal models consistently uncover more influential parameters than conventional process control systems.

Up to
0%
Impact on operational KPIs

Recommended parameter ranges have achieved results like 80% less scrap, tighter centerlining, and significantly measurable progress toward factory targets.

USD
0M+
Cost savings

Proven effective in global enterprise roll-outs by improving labor productivity, reducing waste, and stabilizing processes.

01 Monitor

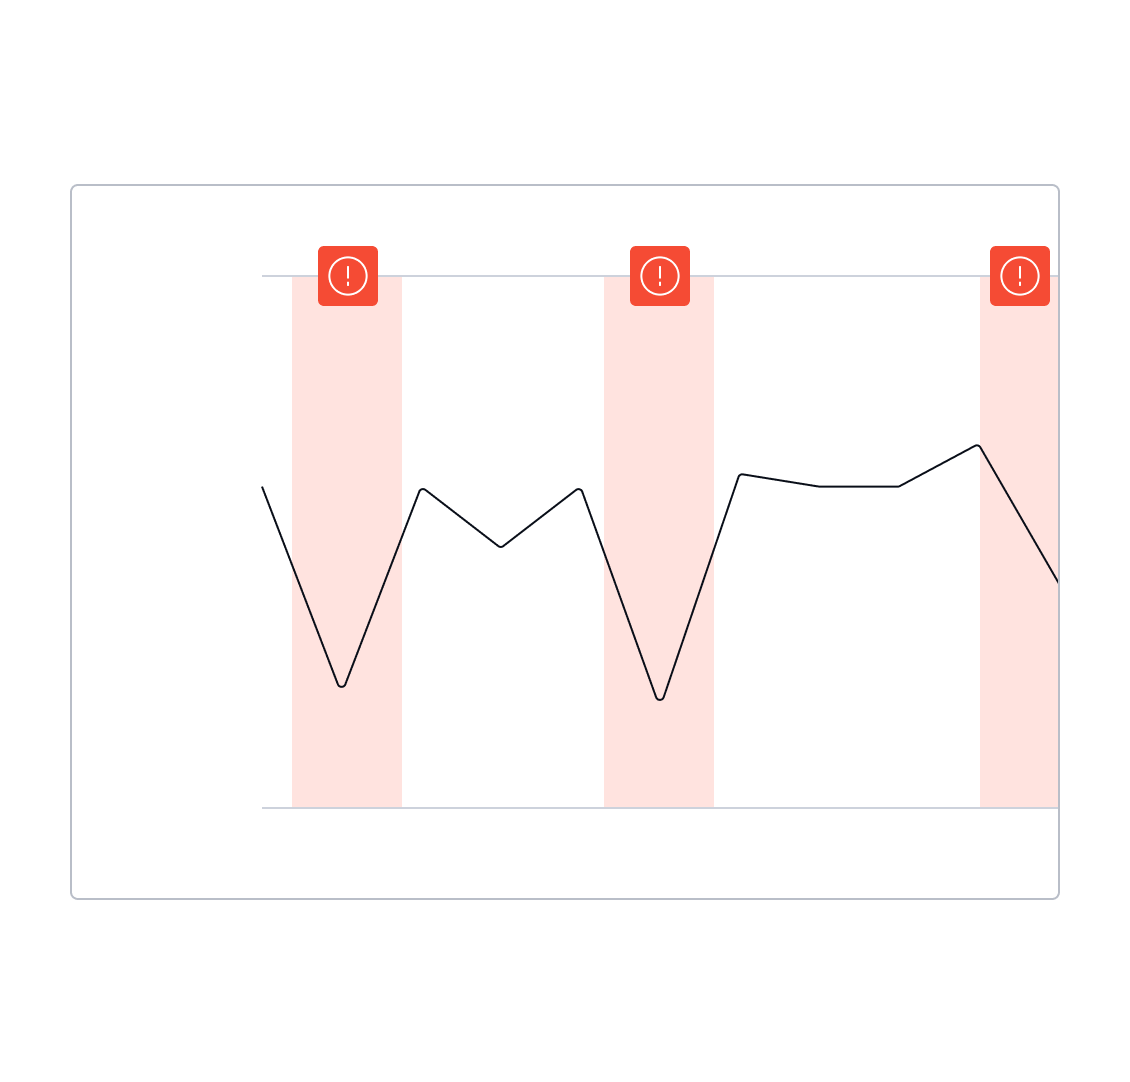
Monitor processes continuously

Ethon continuously monitors process parameters, machine setpoints, and operational outcomes (yield, reject rates, etc.). Autonomous agents detect drifts, inefficiencies, and emerging patterns that signal optimization potential.

Process monitoring chart with a trend line and red alert zones highlighting detected anomalies over time
02 Aggregate

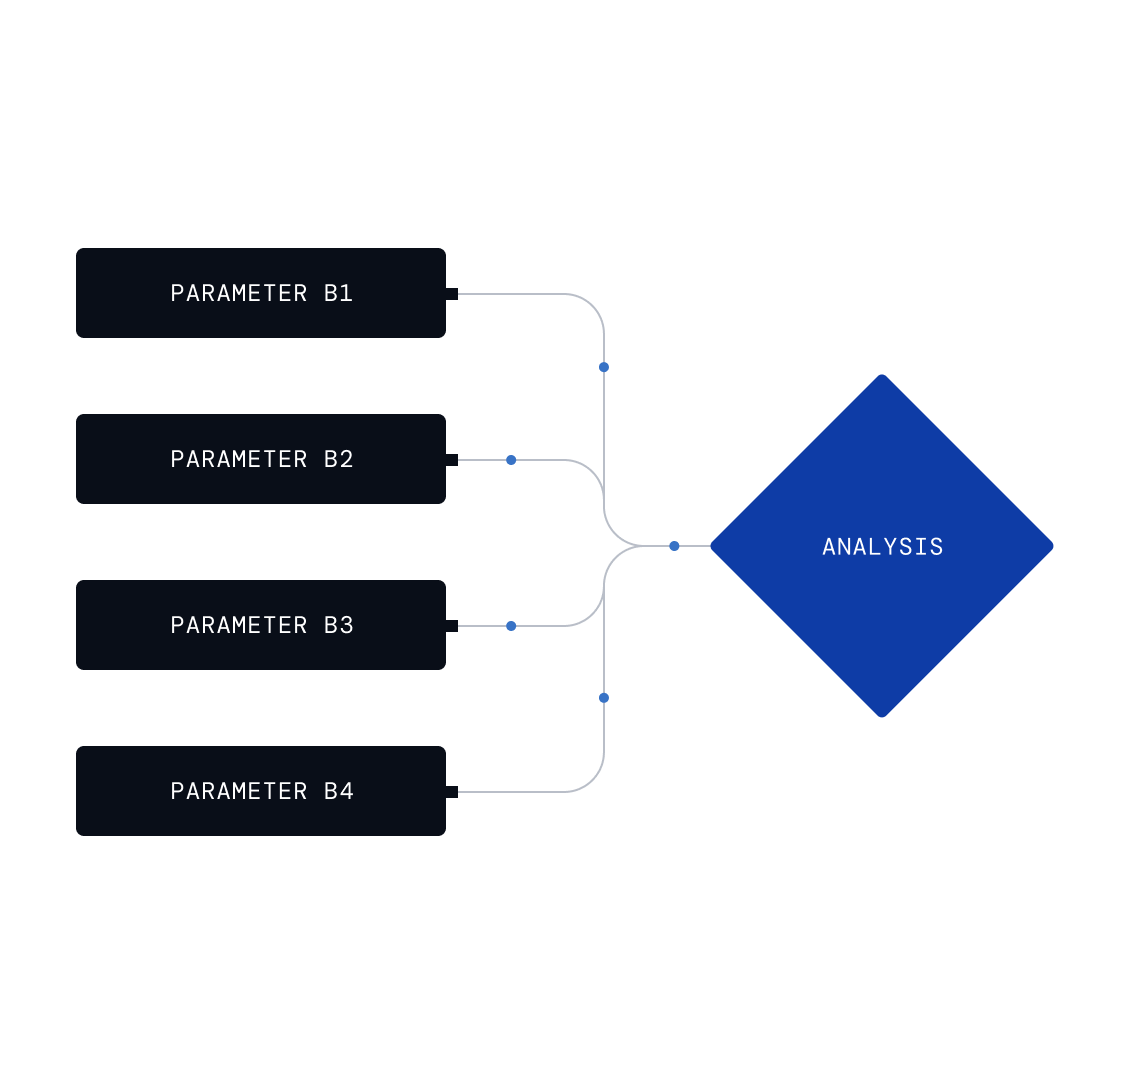
Auto-aggregate all relevant data

Ethon automatically compiles every parameter that could influence the target outcome. It aligns data across units, equipment, and process steps to ensure a complete, structured view of the line.

Data aggregation diagram with four input parameters converging through connected lines into a central analysis node
03 Model

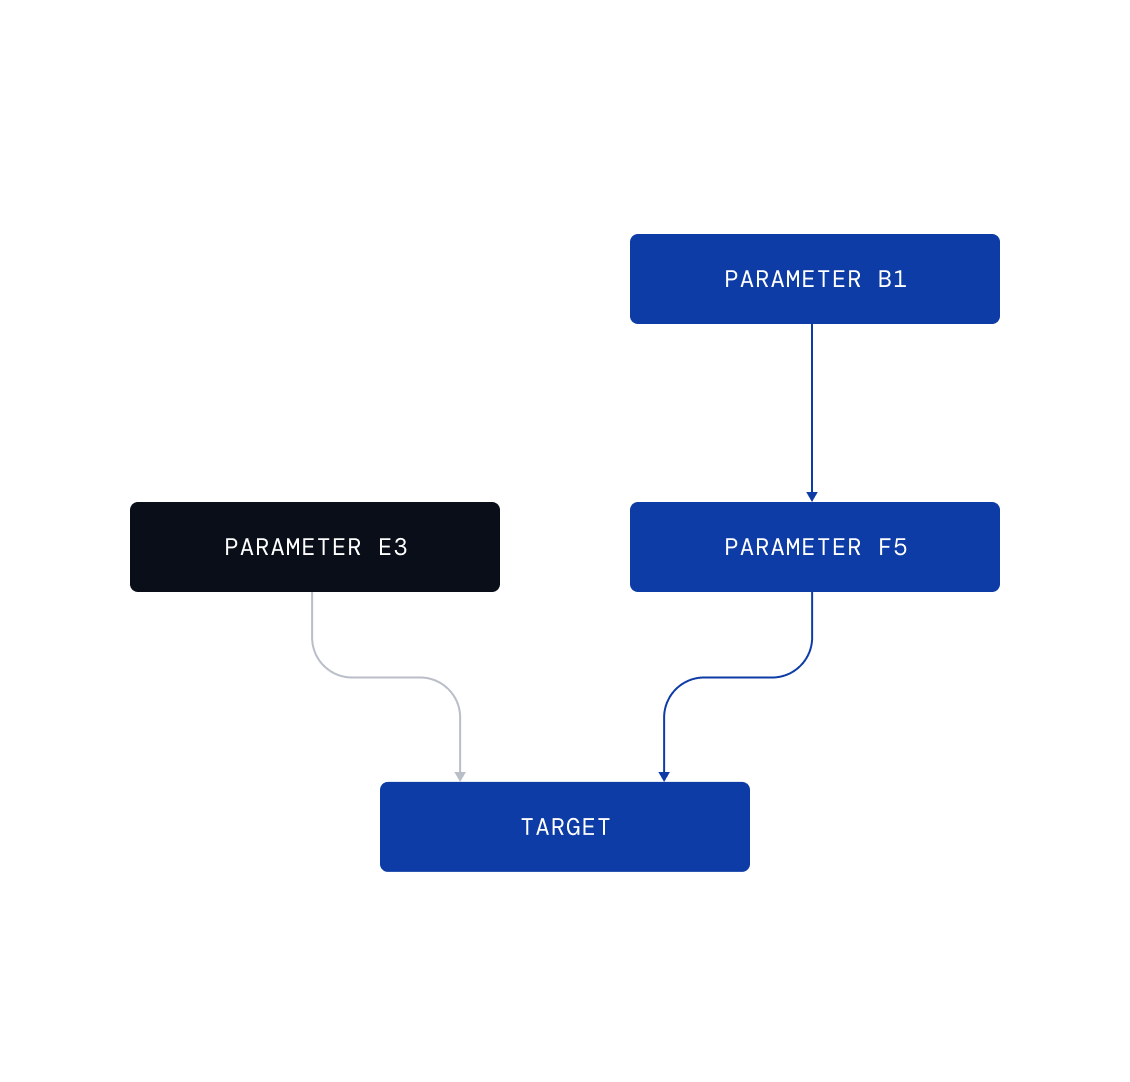
Model how processes actually behave

Ethon uses the process knowledge graph to interpret how each parameter relates to the next. This structure mirrors the physical process, enabling to build a causal model that reflects true cause–effect behavior.

Causal process model diagram showing parameters B1, E3, and F5 connected by directional arrows leading to a target node
04 Diagnose

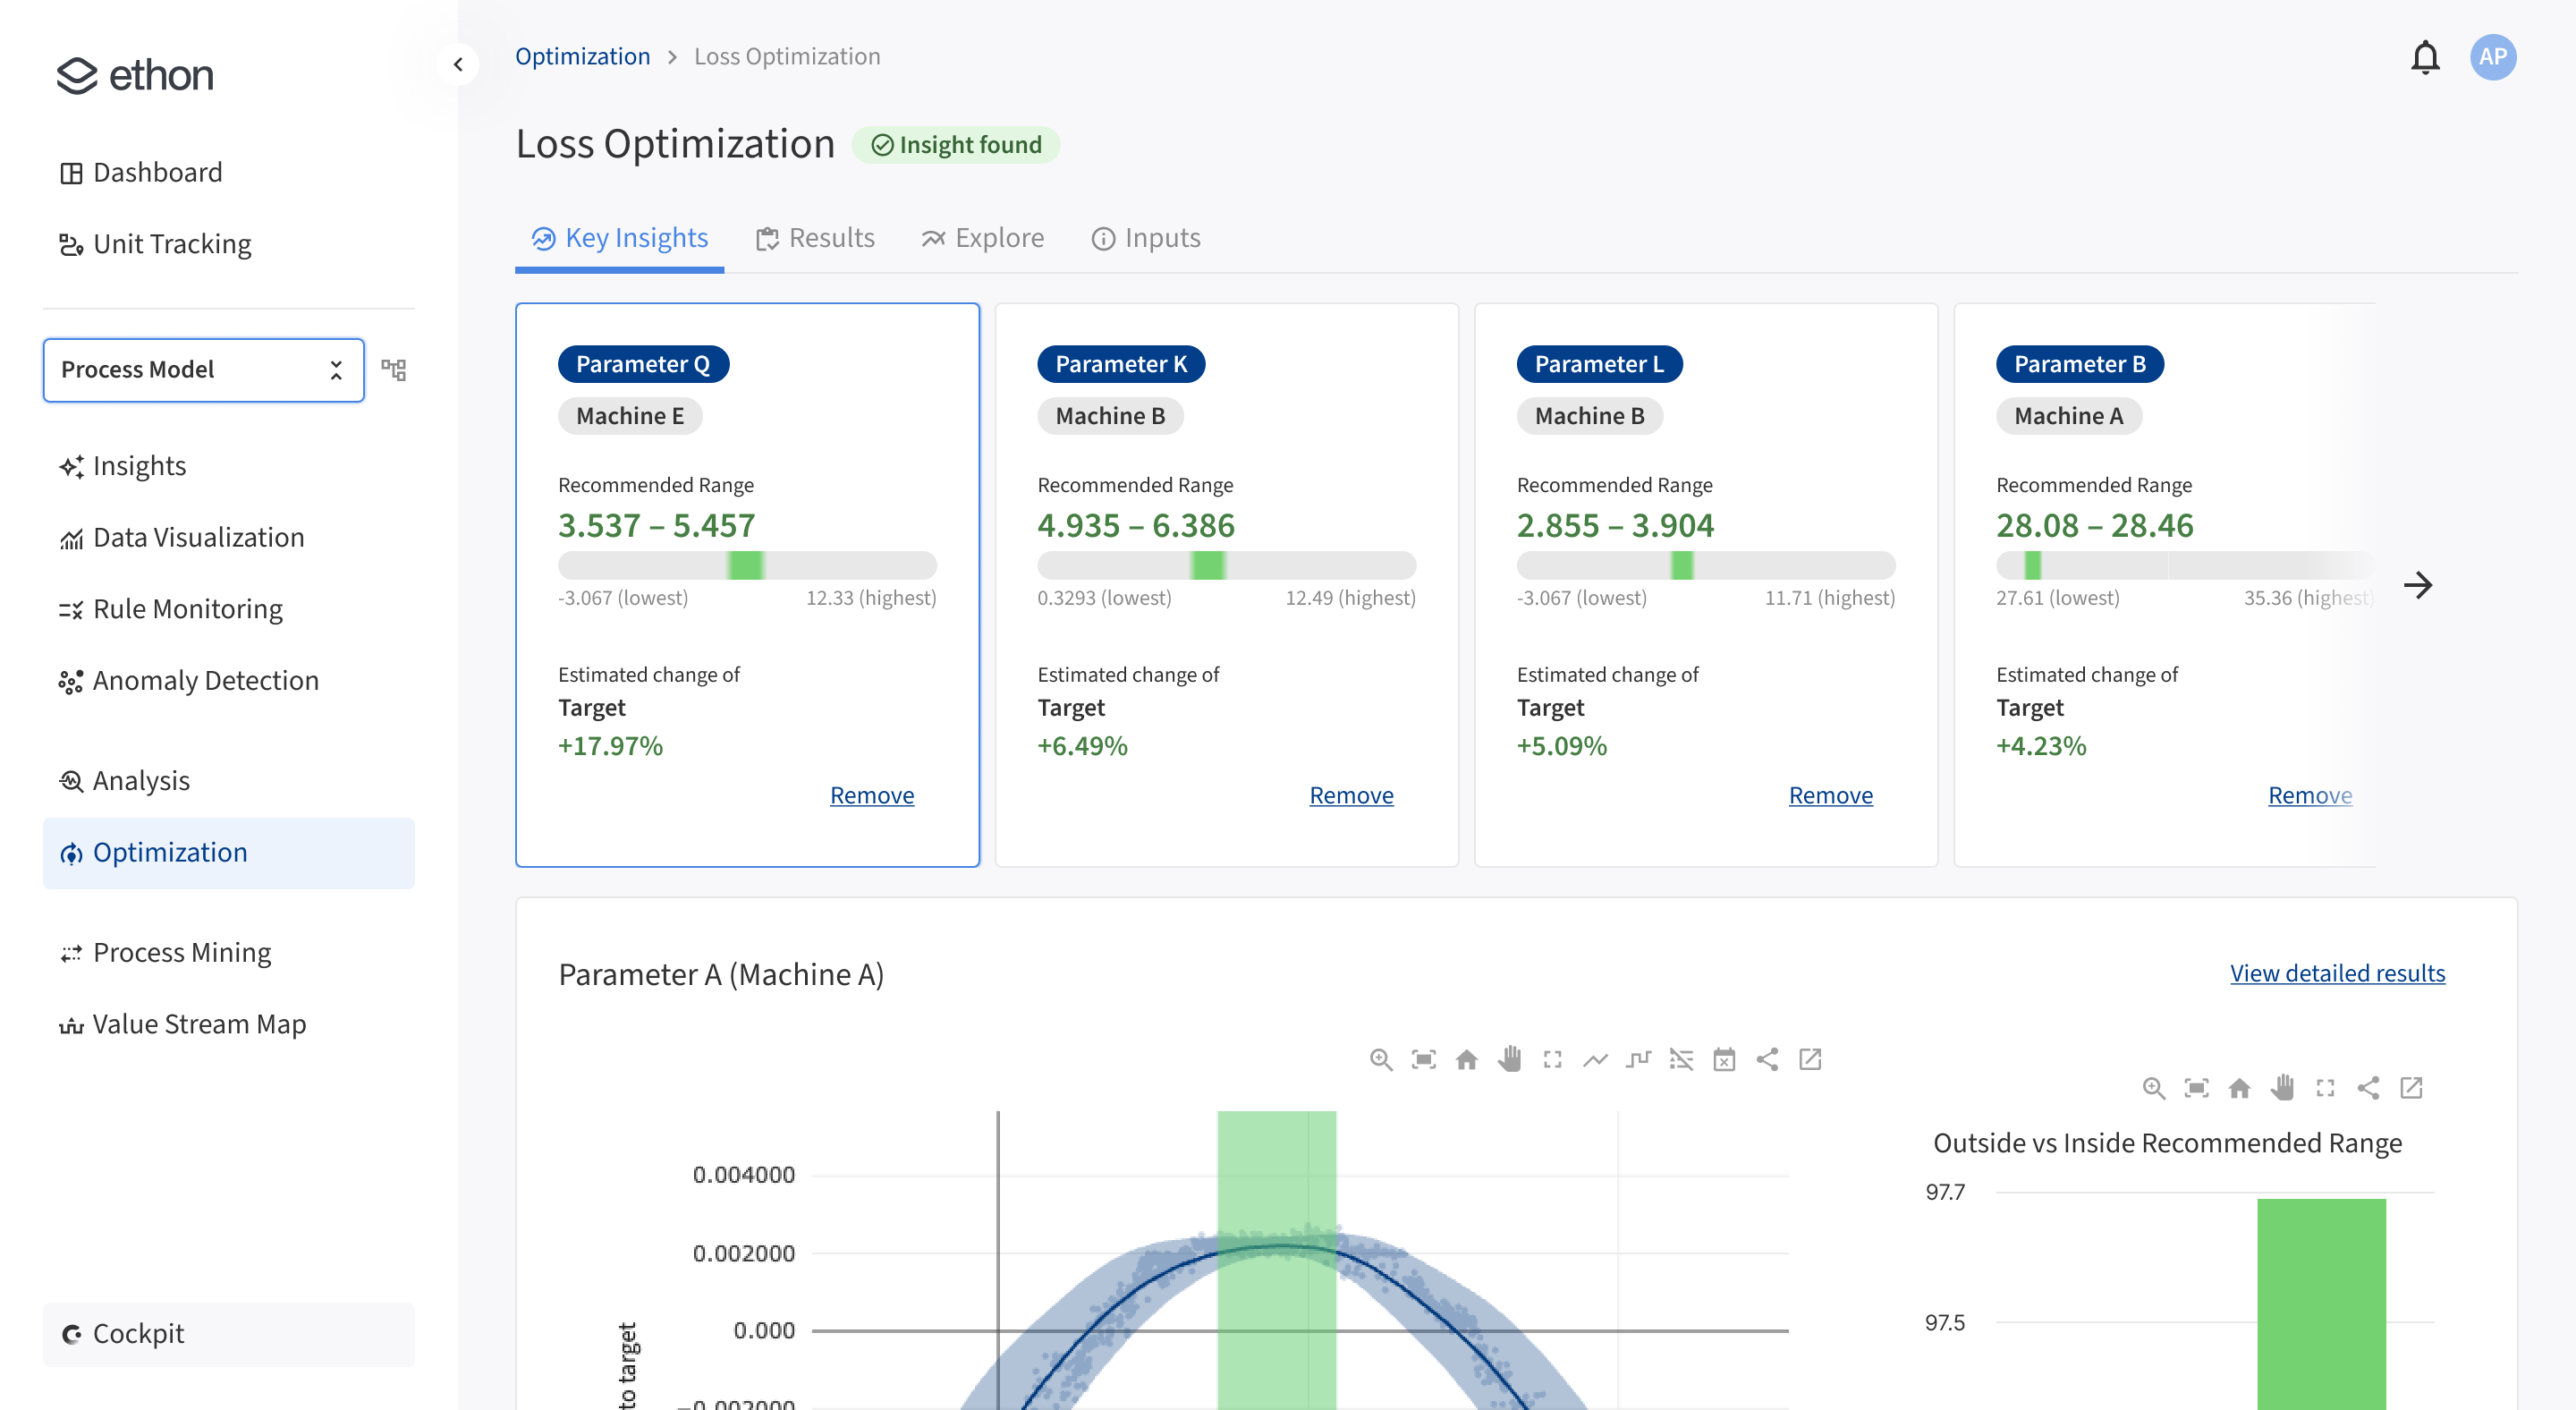
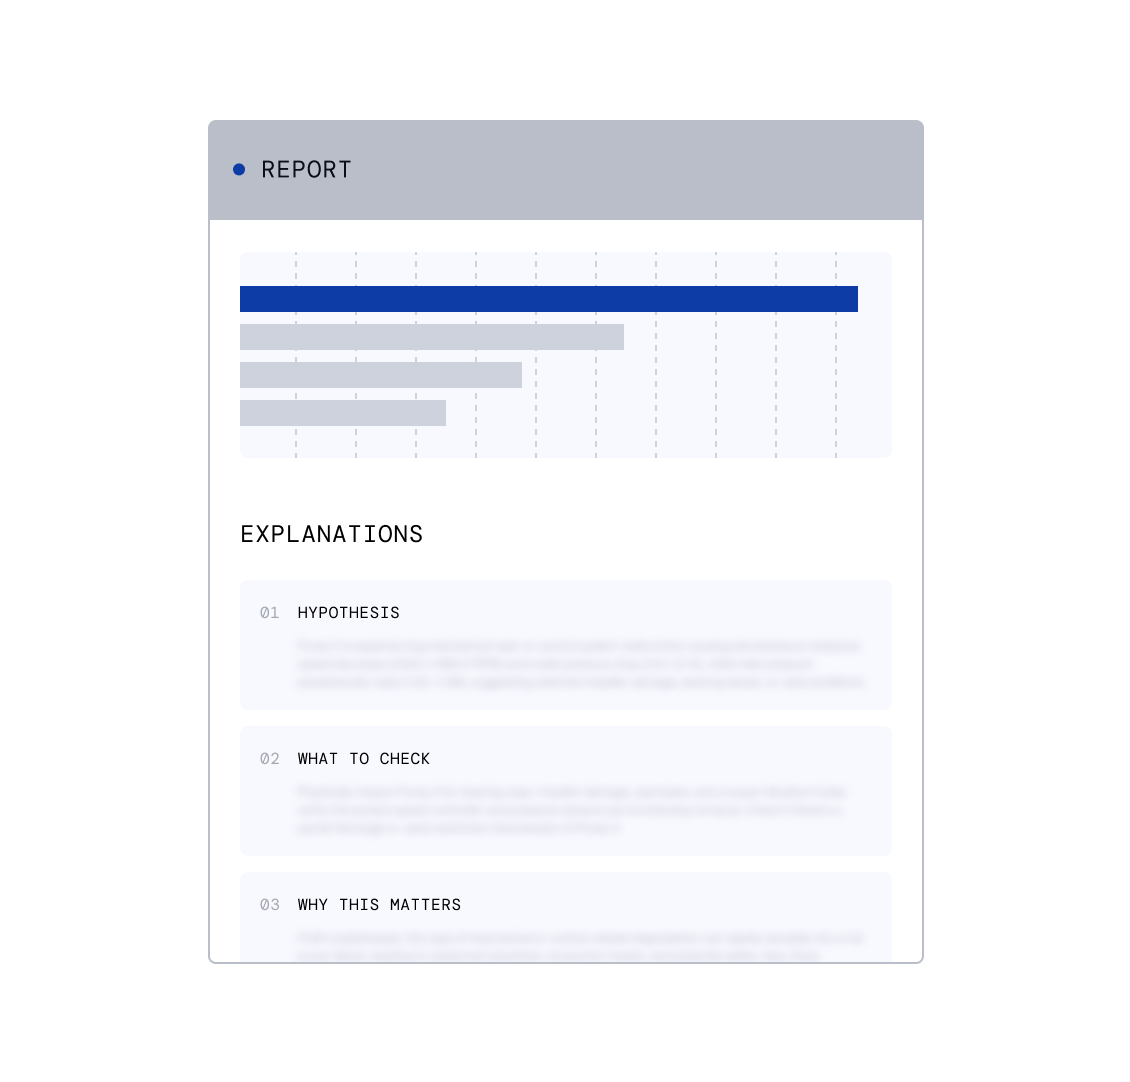
Identify optimization levers

The causal model quantifies which parameters drive performance variation across the process. Users receive a ranked view of influential inputs and process steps, highlighting where improvements matter most.

Report with bar chart and explanations showing hypothesis, what to check, and why it matters for optimization drivers
05 Recommend

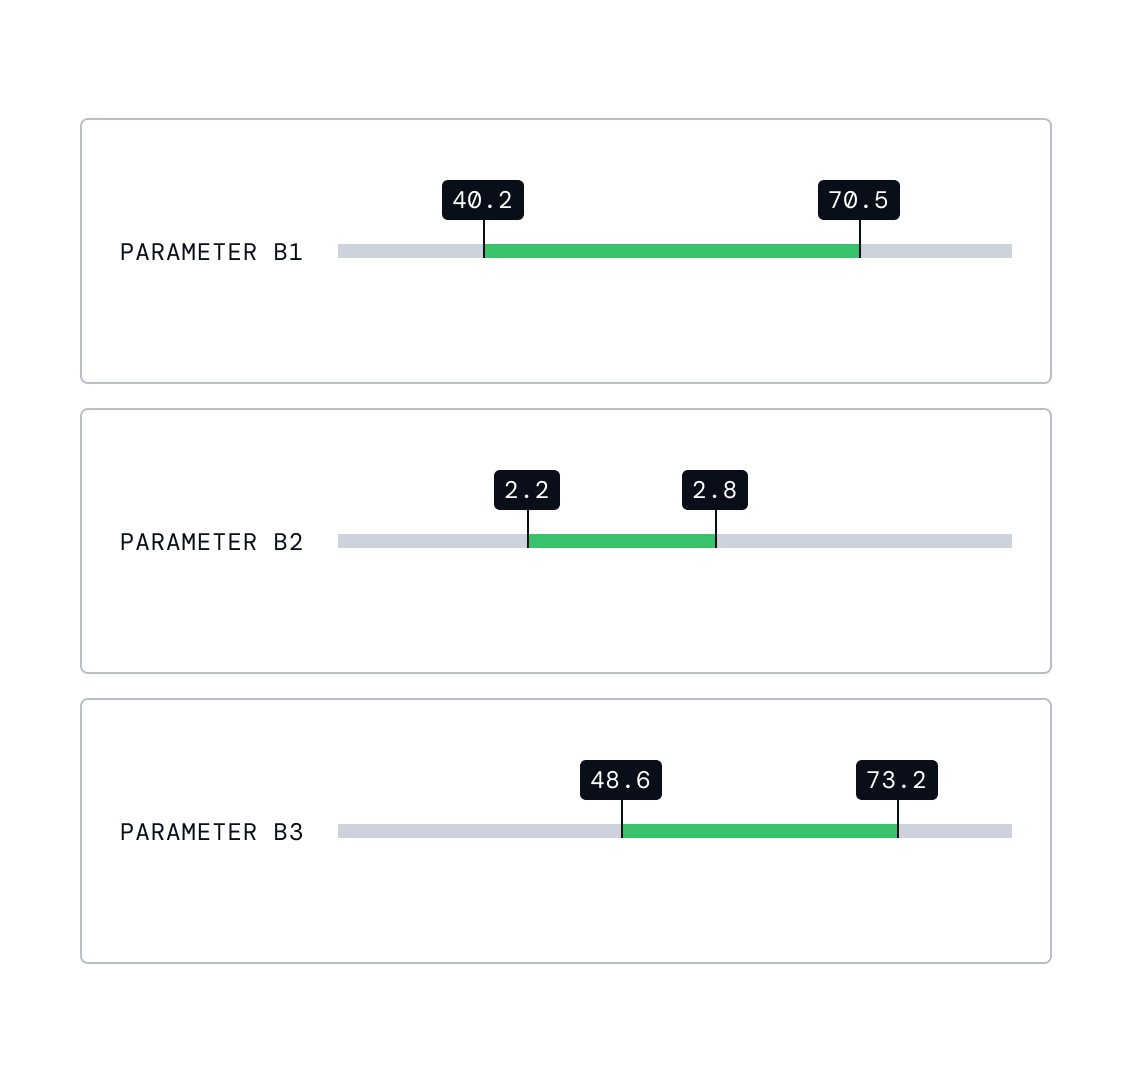
Recommend optimal setpoints

Based on the causal graph and historical behavior, Ethon computes recommended setpoints for key parameters. Each recommendation includes a quantified impact estimate and direction of change.

Range sliders showing optimal setpoint recommendations for three process parameters with min-max values
06 Simulate

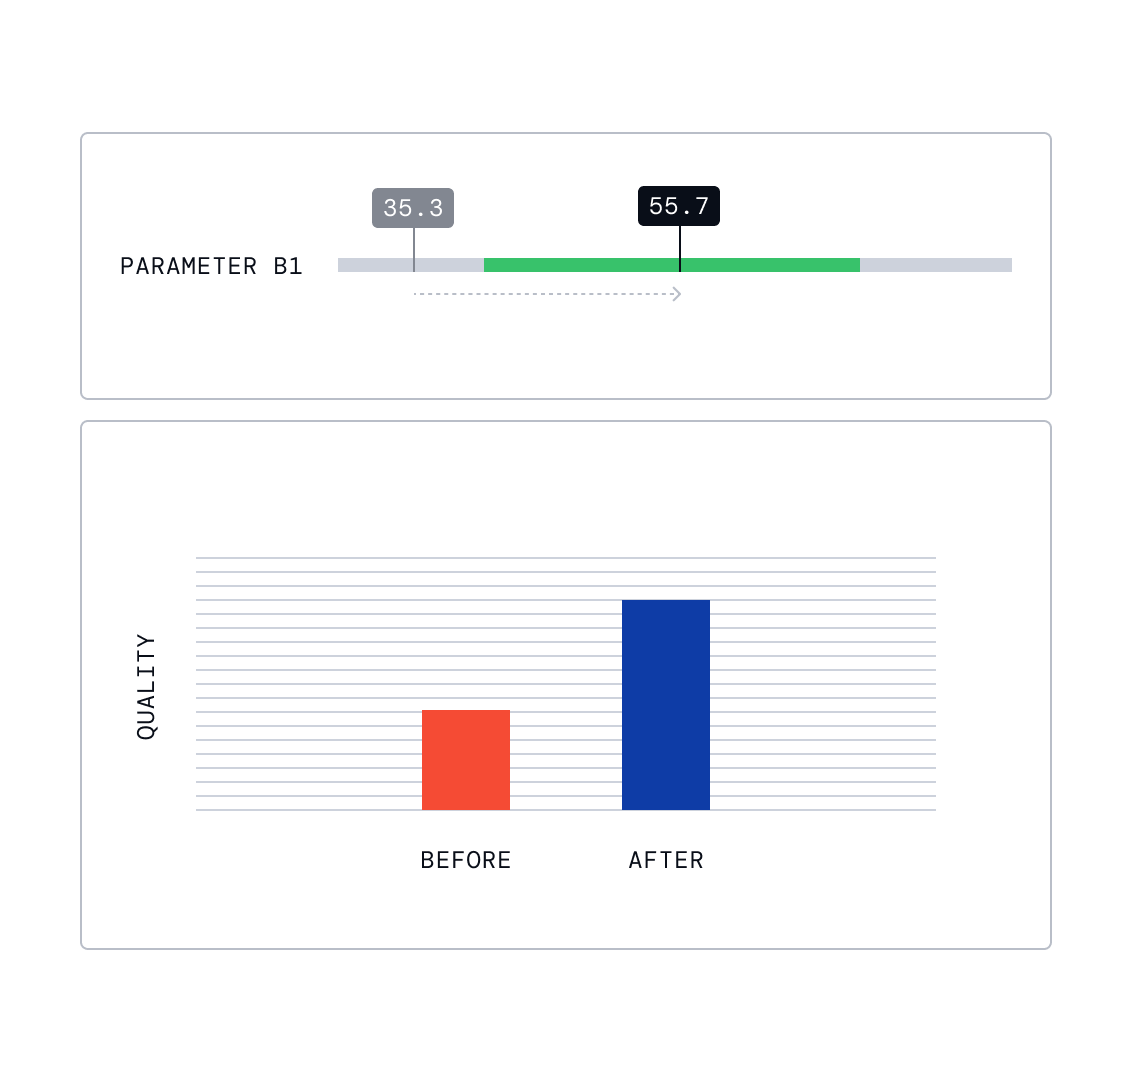
Simulate improvement scenarios

Users can simulate how adjustments to specific parameters would affect process outcomes. The interface compares current performance with simulated scenarios to reveal optimal operating conditions.

What-if simulation showing parameter B1 slider adjusted from 35.3 to 55.7 with before-and-after quality comparison chart
07 Operationalize

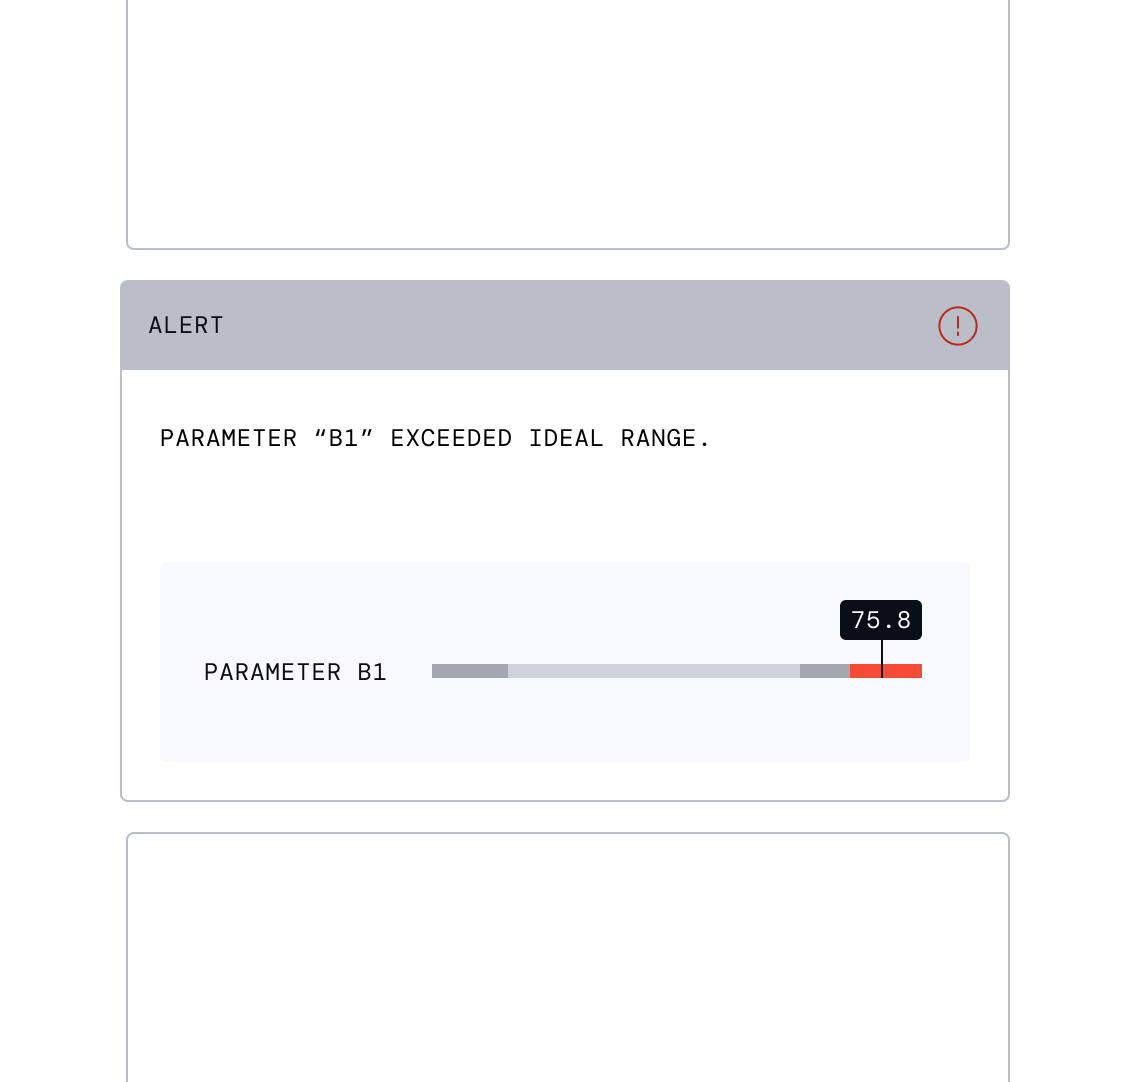
Lock in gains with rule-based monitoring

Users convert recommended ranges into rule-based monitors. These rules track adherence in real-time and alert the shop floor when parameters deviate from optimized ranges, ensuring the process stays within its ideal window.

Alert notification showing parameter A1 exceeded ideal range with B1 gauge bar highlighting the violation

Frequently asked questions

What are typical use cases for process optimization?
Process optimization focuses on continuously improving production outcomes such as yield, throughput, energy consumption, cycle time, and scrap rates. Typical use cases include stabilizing yield across shifts, reducing variability caused by raw material changes, increasing throughput without sacrificing quality, and finding parameter settings that consistently hit target KPIs under changing operating conditions.
What data does Ethon need to perform process optimization?
Ethon connects to existing factory data sources such as MES, PLCs, Historians, sensors, and IoT platforms. The more complete the process data, the more precise the causal explanations, but even limited datasets can provide meaningful insights.
How much data is needed to get meaningful insights?
What matters most is variation, not volume. If a process always runs at one fixed setpoint, no algorithm can find what drives the problem. EthonAI works with anything from 30–40 batches or parts to millions of production runs, and from about 10 to several thousand measured parameters. As long as the data shows enough change, the software can reveal true cause-and-effect relationships.
Does Ethon require data scientists to use?
No. The workflow is designed for process experts and operators. Analyses are triggered automatically, and results are presented as clear, explainable reports. That said, many data scientists use Ethon through our Jupyter notebook integration to pull results directly, compare them with custom analyses, and extend workflows using Python.
Can Ethon really deliver results in minutes?
Yes. By combining automated diagnostics with causal reasoning, Ethon identifies, explains, and reports optimization levers in minutes. What used to take weeks can now be done instantly—unlocking hidden potential across sites and preventing issues from recurring.

Stop chasing problems.
Stay in control.

Meet our engineers to explore how Ethon supports your operational excellence programs.